UK · Updated monthly · Figures to June 2026
How has the UK done since Brexit?
The TL;DR: There wasn't a collapse, long term at least, but there wasn't a boom either. It's all a bit stagnant and needs decisions to be made. And nobody followed Britain out.
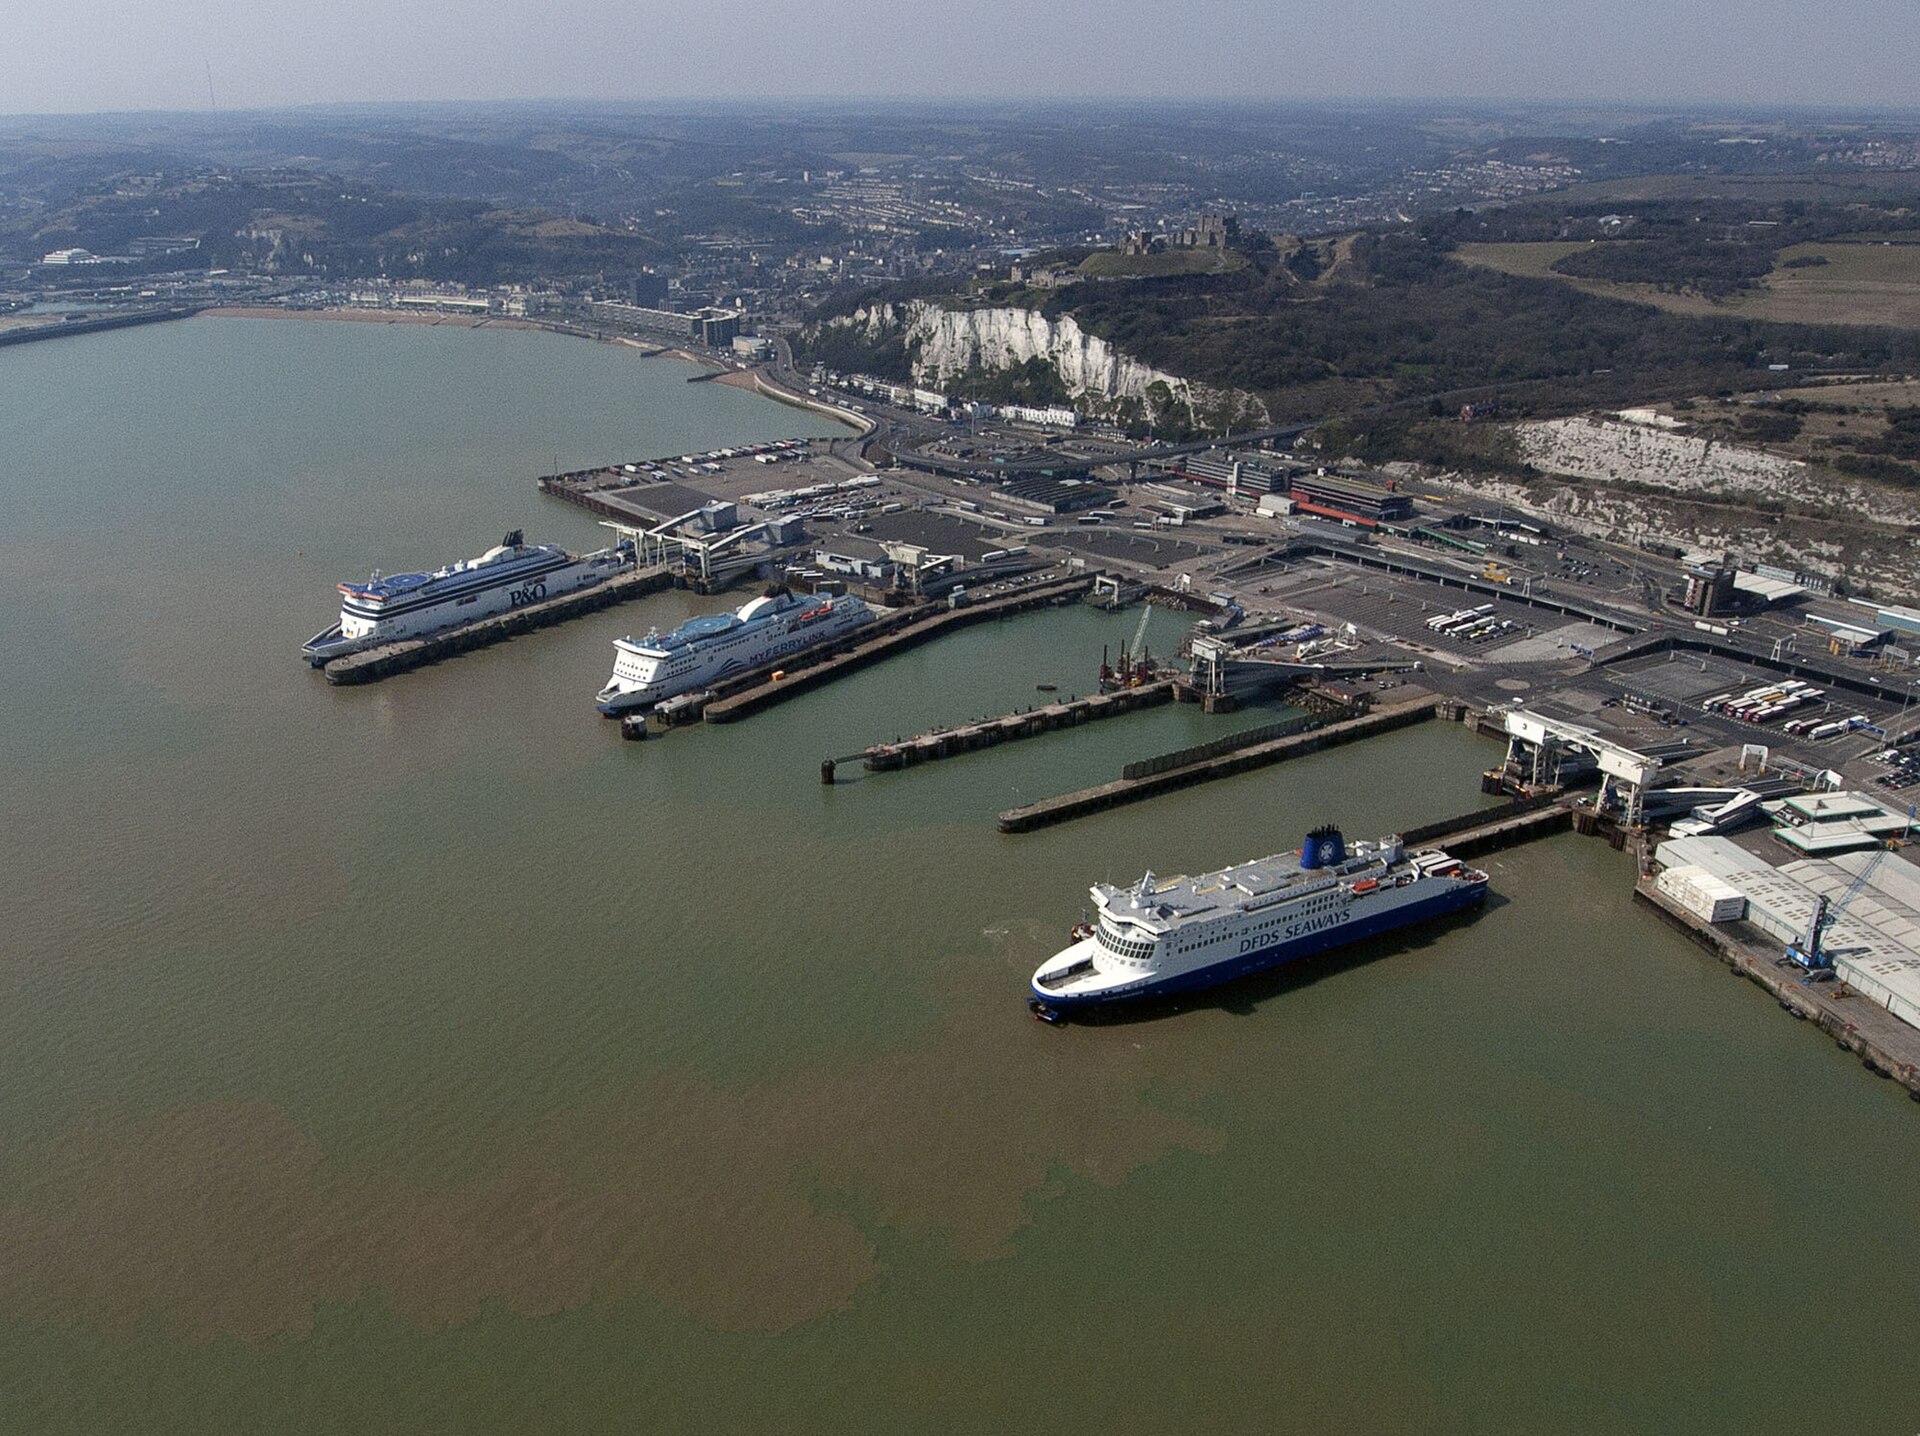
Nearly a decade on, Brexit is still argued about as if the results weren't in yet. Some of them aren't - economies don't run control groups - but a lot of them are, sitting in plain sight in the UK's own official statistics. So here they are: trade, growth, pay, jobs and the pound, measured before and after that infamous evening.
So, what are we looking at, exactly?
The share of Britain's goods exports that go to the EU, month by month since 1997 - the single line people usually mean when they ask whether Brexit "killed trade with Europe". Two notes before reading it: the counting method changed in January 2021, when customs declarations replaced the old EU reporting system (the ONS adjusts for it, but treat the line's level around then with care), and it counts goods only - services, these days more than half of Britain's exports, are measured separately and more slowly. The EU's share fell from 57% in 1997 to 47% by the referendum - a 9-point slide over two decades of globalisation - and since the vote it has moved 0.8 points. The big rebalancing happened before anyone voted on it.
Did Brexit shrink the economy?
Not in the way the starkest warnings said, and not harmlessly either - both camps get a number here. The economy kept growing: +0.6% in Q1 2026, unemployment is 4.9% against 4.9% at the referendum, and no recession arrived on exit day. What the forecasters maintain is that growth has been slower than it would have been: the Office for Budget Responsibility's standing estimate is that leaving reduces long-run productivity by around 4% relative to remaining - a counterfactual, clearly labelled as one, and the number both sides argue over. The table below puts the UK's recent quarters against the US and Canada, measured the same way.
| Quarter | UK | US | Canada |
|---|---|---|---|
| Q1 2025 | +0.6% | −0.2% | +0.7% |
| Q2 2025 | +0.2% | +0.9% | −0.2% |
| Q3 2025 | +0.1% | +1.1% | +0.5% |
| Q4 2025 | +0.1% | +0.1% | −0.2% |
| Q1 2026 | +0.6% | +0.5% | −0.0% |
What happened to the pound?
The night of the referendum result remains the sharpest move on this chart: sterling fell hard against the dollar within hours, and it has never regained its pre-vote level - $1.48 on referendum eve, $1.36 now, −7.8%. A weaker pound cuts both ways, which is why both camps can live with this chart: imports and foreign holidays cost Britons more, while British exports got cheaper for everyone else. It's also the cleanest example of what markets, as opposed to campaigners, concluded on the night.
What happened to pay?
Here's the series closest to how the decade actually felt: average weekly pay in constant money - what a week's work buys, with inflation stripped out. It stands at £533 a week, +8.8% since the referendum. For scale, real pay's pre-referendum peak was £516, set in March 2008 - the stagnation that number describes started with the 2008 financial crisis, well before Brexit, and the sterling-driven inflation of 2017 and the 2022 energy shock each took their own bite. The line carries all of it.
Did anyone follow Britain out?
No. Article 50 - the EU treaty clause a country invokes to leave - has been used exactly once in the union's history: by the UK in 2017. The continental exit movements that polled seriously around 2016 faded rather than grew, and the EU's own Eurobarometer surveys have recorded support for EU membership across member states rising since the referendum, not falling. Whatever each side hoped the example would prove, the observable answer is that the rest of the club watched - and stayed put. Canada's current standoff with Washington is the same question in a different accent: what does leaving your biggest trading relationship actually cost?
Countries that have invoked Article 50 in the EU's history
1 - the United Kingdom
The EU's share fell 9 points in the two decades before the referendum and has moved 0.8 points in the decade since. The counting change of 2021 blurs the recent level - the long shape doesn't change.
Calculated from the chart at the topTotal trade peaked at 69% of GDP in 2022 and stands at 62% (2025). Trade intensity, not any single trade deal, is where the forecasters' long-run worry lives.
World Bank, World Development IndicatorsWhat these charts can't tell you
The biggest thing: what the UK would look like had it stayed. Economies don't run control groups, so every "cost of Brexit" figure - including the OBR's - is a modelled comparison against a Britain that doesn't exist, and this page keeps such figures labelled as estimates rather than measurements. The trade line counts goods, not services, and carries the 2021 counting change. Pay and growth were hit in this decade by a pandemic and an energy shock that had nothing to do with the EU. And nothing here measures the things many people actually voted about - sovereignty, immigration, identity - which don't appear in any of these series and are not this page's verdict to give.
Further reading
All of our numbers come from live, free official sources - trade, growth, jobs and pay from the Office for National Statistics (published under the Open Government Licence v3.0), the pound from the Federal Reserve via FRED, and the annual context from the World Bank. Every figure on this page is calculated from those series, and the page updates as they do.
If you want to dig deeper: the OBR's Brexit analysis is the standard reference for the estimates both sides argue over - and the live version of this page's question is playing out in our Canada vs the US coverage.