Canada · Updated monthly · Figures to July 2026
How is Canada doing, compared to the US?
Mark Carney has called time on trade talks with Washington, so here is the split, measured: Canada's economy grew +0.8% last quarter to America's +0.4%, unemployment is 6.4% against 4.1%, and the $722bn of goods crossing the border each year is drifting, not collapsing.
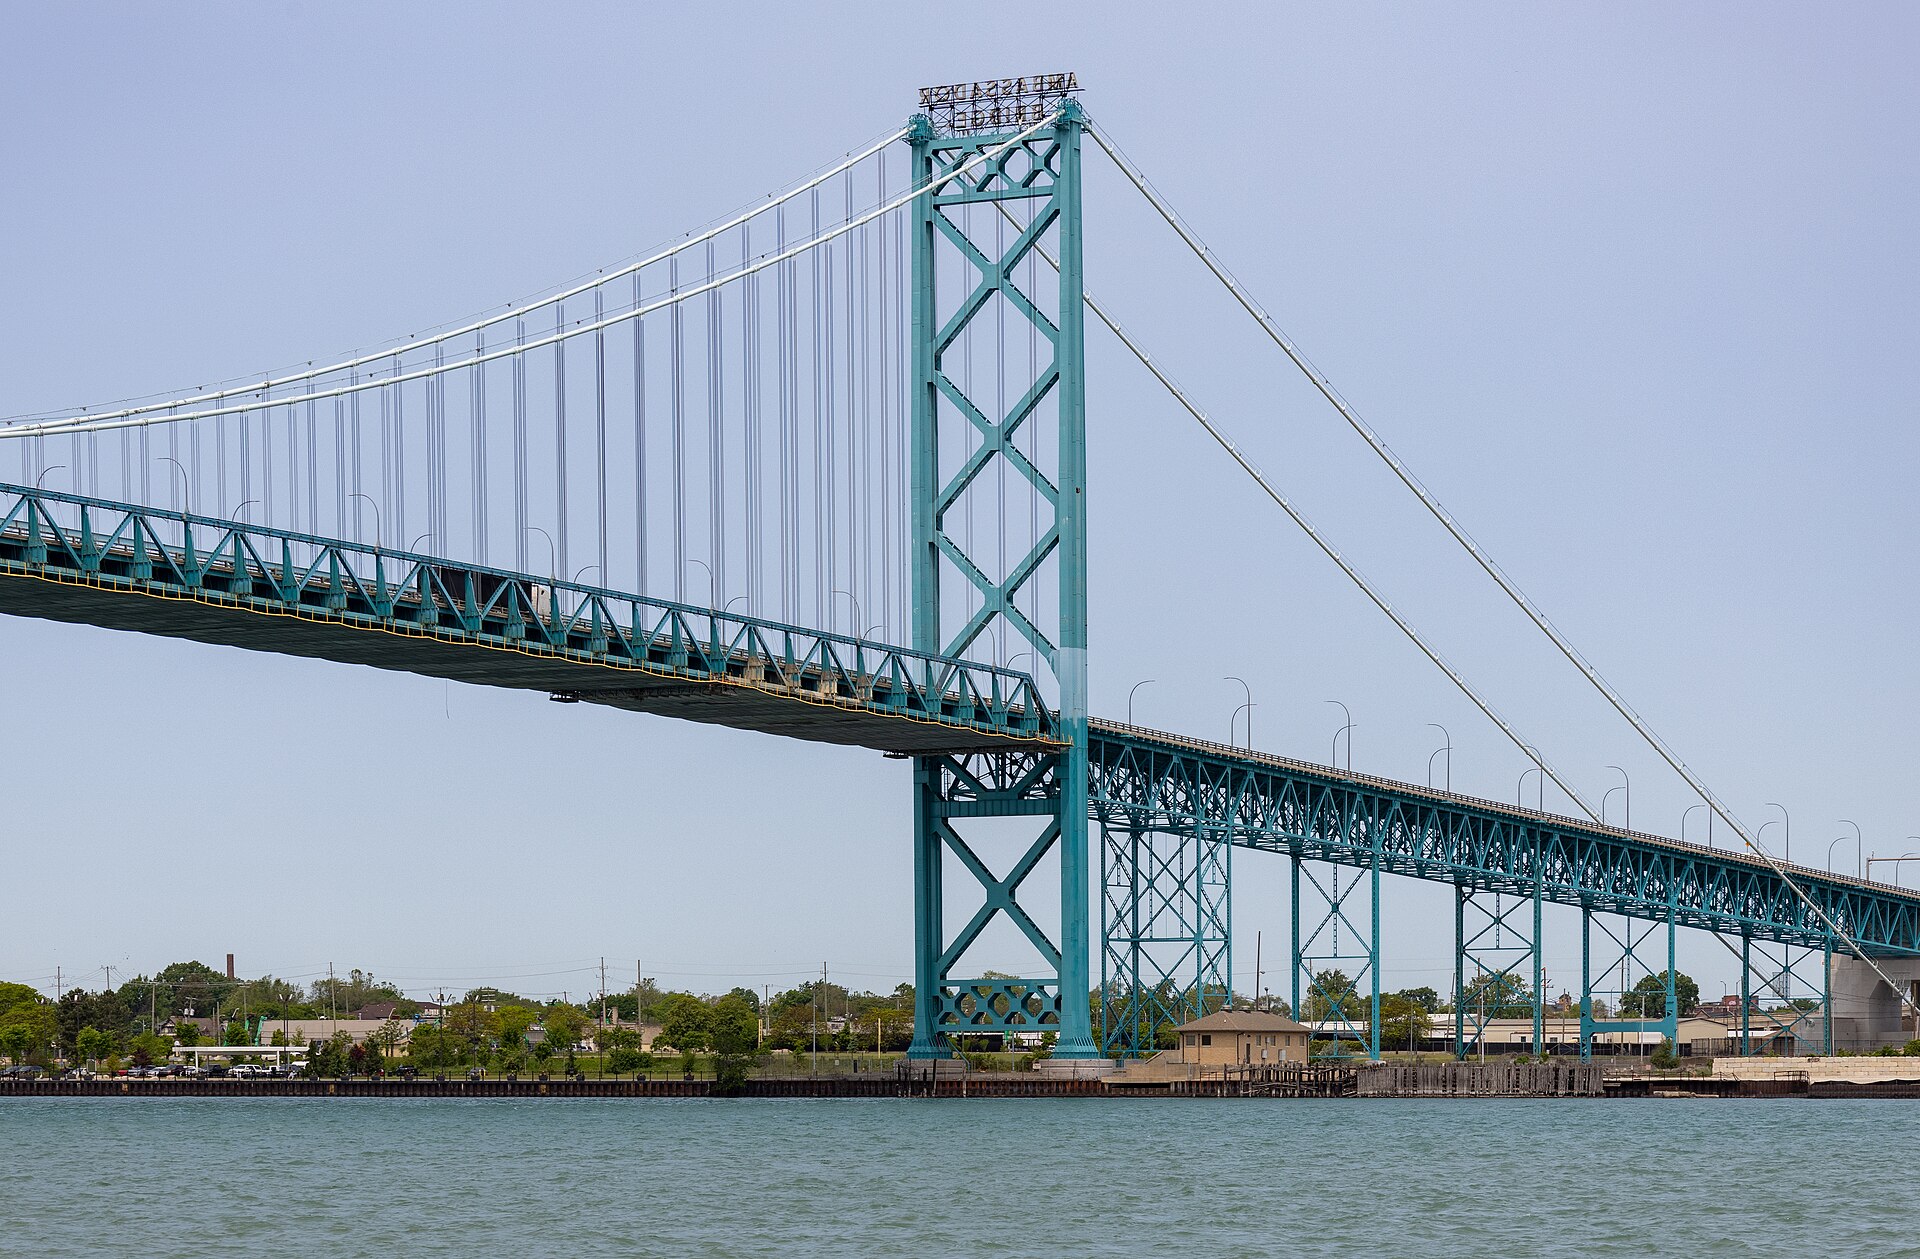
On 22 August, Mark Carney stood on Parliament Hill and ended Canada's trade negotiations with the United States. If you're wondering what that moment means in practice - for one of the biggest trading relationships on earth, and for the two economies on either end of it - the useful answer is numbers, not adjectives. So here is the border, measured: what still crosses it, who is growing, who is carrying more unemployment, and what the market thinks a Canadian dollar is worth.
So, what are we looking at, exactly?
Every dollar of goods that crosses the US-Canada border, in both directions, added up over a rolling year - the US Census Bureau counts it month by month, and we've stacked the two flows into one line. It's worth staring at the scale before the politics: about $722bn of goods a year, roughly a lorry-load every few seconds. And here's the part the headlines miss: over the first 6 months of this year the flow was 1.6% higher than the same months last year, while the 12-month total sits 3.8% below where it stood a year earlier. The divorce has been announced, and the goods have kept crossing anyway. The 12-month line has begun to bend down, but only slightly so far - which is exactly why this chart earns a monthly watch.
What did Carney's speech say?
The address (the full transcript is on the Prime Minister's site) ended more than a year of negotiation. On why the talks died: "they asked too much and offered too little". On trusting Washington's agreements, the line already being quoted back: America's "signature was written in pencil". Carney said Canada will match the new US tariffs dollar for dollar, concentrated in sectors such as steel, dairy and appliances, and framed the strategy ahead as "building Canada strong at home and diversifying our trading relationships abroad". The speech confirms what he first signalled early last year: the decades-long integration of the two economies, in his words, "was over". What that costs each side is what the rest of this page measures.
Is Canada in a recession?
No - not on the latest count. Canada's economy grew +0.8% in Q2 2026 (quarter on quarter, before annualising) - faster than the United States managed. The table below puts the two countries' last five quarters side by side, measured the same way (the OECD's like-for-like method, so neither country's own presentation flatters it).
| Quarter | Canada | United States |
|---|---|---|
| Q2 2025 | −0.2% | +0.9% |
| Q3 2025 | +0.5% | +1.1% |
| Q4 2025 | −0.2% | +0.1% |
| Q1 2026 | +0.0% | +0.5% |
| Q2 2026 | +0.8% | +0.4% |
Who carries more unemployment?
Canada, at 6.4% against America's 4.1% - and that has been the usual state of things for decades, partly because the two countries count slightly differently and the chart below uses a harmonised measure to iron that out. What matters is the gap's direction: it stands at +2.3 percentage points now, wider than usual (the whole record averages +1.4). The chart is that gap, month by month - when it widens, Canada's labour market is taking more of the strain; when it narrows toward zero, the two are converging.
What does the market think? Watch the loonie
Exchange rates are the running vote no government controls. A Canadian dollar buys 71.8 US cents as of August 2026 - below its five-year average of 74.1 cents, and down from 72.5 a year ago. Currencies move for many reasons at once (interest rates, oil, risk appetite), so treat this line as a mood reading rather than a verdict - but a sustained slide here is how markets price a smaller, harder-borders Canadian economy, and a recovery is how they'd price the diversification working.
Goods still crossing the US-Canada border, per year
$722bn
In the first full quarter of the tariff war, Canada grew +0.8% to the US's +0.4%. One quarter is weather, not climate - but it is not the collapse the rhetoric promised.
Calculated from the table aboveTariffs raise the price of trade before they end it: so far the dollars crossing the border have held up even as the relationship soured. The months ahead of this chart are the test.
Calculated from the chart at the topWhat these charts can't tell you
They count goods, not services - finance, tourism and software cross this border too, on data that arrives more slowly. The trade counts lag by about two months, so the newest tariffs' effects reach this page with a delay. Growth and unemployment come from each country's own statistical agency, harmonised by the OECD - trustworthy, but revised as better data lands. And none of this scores the politics: whether the split was wise is a judgement these pages leave with you; what it measurably does, month by month, is what we're here for.
Further reading
All of our numbers come from live, free sources - the goods trade from the US Census Bureau via FRED, growth and unemployment from the OECD's harmonised series, and the exchange rate from the Federal Reserve. Every figure on this page is calculated from those series, and the page updates as they do.
If you want to dig deeper: the full speech transcript is worth ten minutes of anyone's time, and the American side of this story runs through our trade deficit and dollar pages.