Food & climate · Updated monthly · Figures to July 2026
What is the Climate doing to food prices?
It's in the chocolate and the coffee before it's in the news: cocoa peaked at 4.5 times its 20-year average, and arabica trades at 2.6 times its pre-2021 level. Not everything is dearer - and that contrast is the story.
If the chocolate bar and the bag of coffee have crept up faster than the rest of your shopping, that's not your imagination - and the reason reaches further back than the shop. This page follows the world market prices of 11 everyday food commodities, the prices countries and manufacturers pay before anything is roasted, shipped or wrapped. Two of them have broken away from the pack, the science connecting them to a changing climate is unusually direct - and, just as usefully, most of the basket has done nothing of the kind.
So, what are we looking at, exactly?
The World Bank has recorded the world market price of the major commodities every month since 1960 - one clean number per commodity, in dollars, before any country's taxes, transport or shop margins. The chart above is cocoa, the bean behind chocolate, since 2000. For most of that record it traded near its 20-year average of $2.39 a kilo. In January 2025 it hit $10.75 - 4.5 times that average - and though the spike has passed, today's $5.61 is still 2.3 times the old normal. The surge ended; the price didn't come home.
Why is chocolate so expensive?
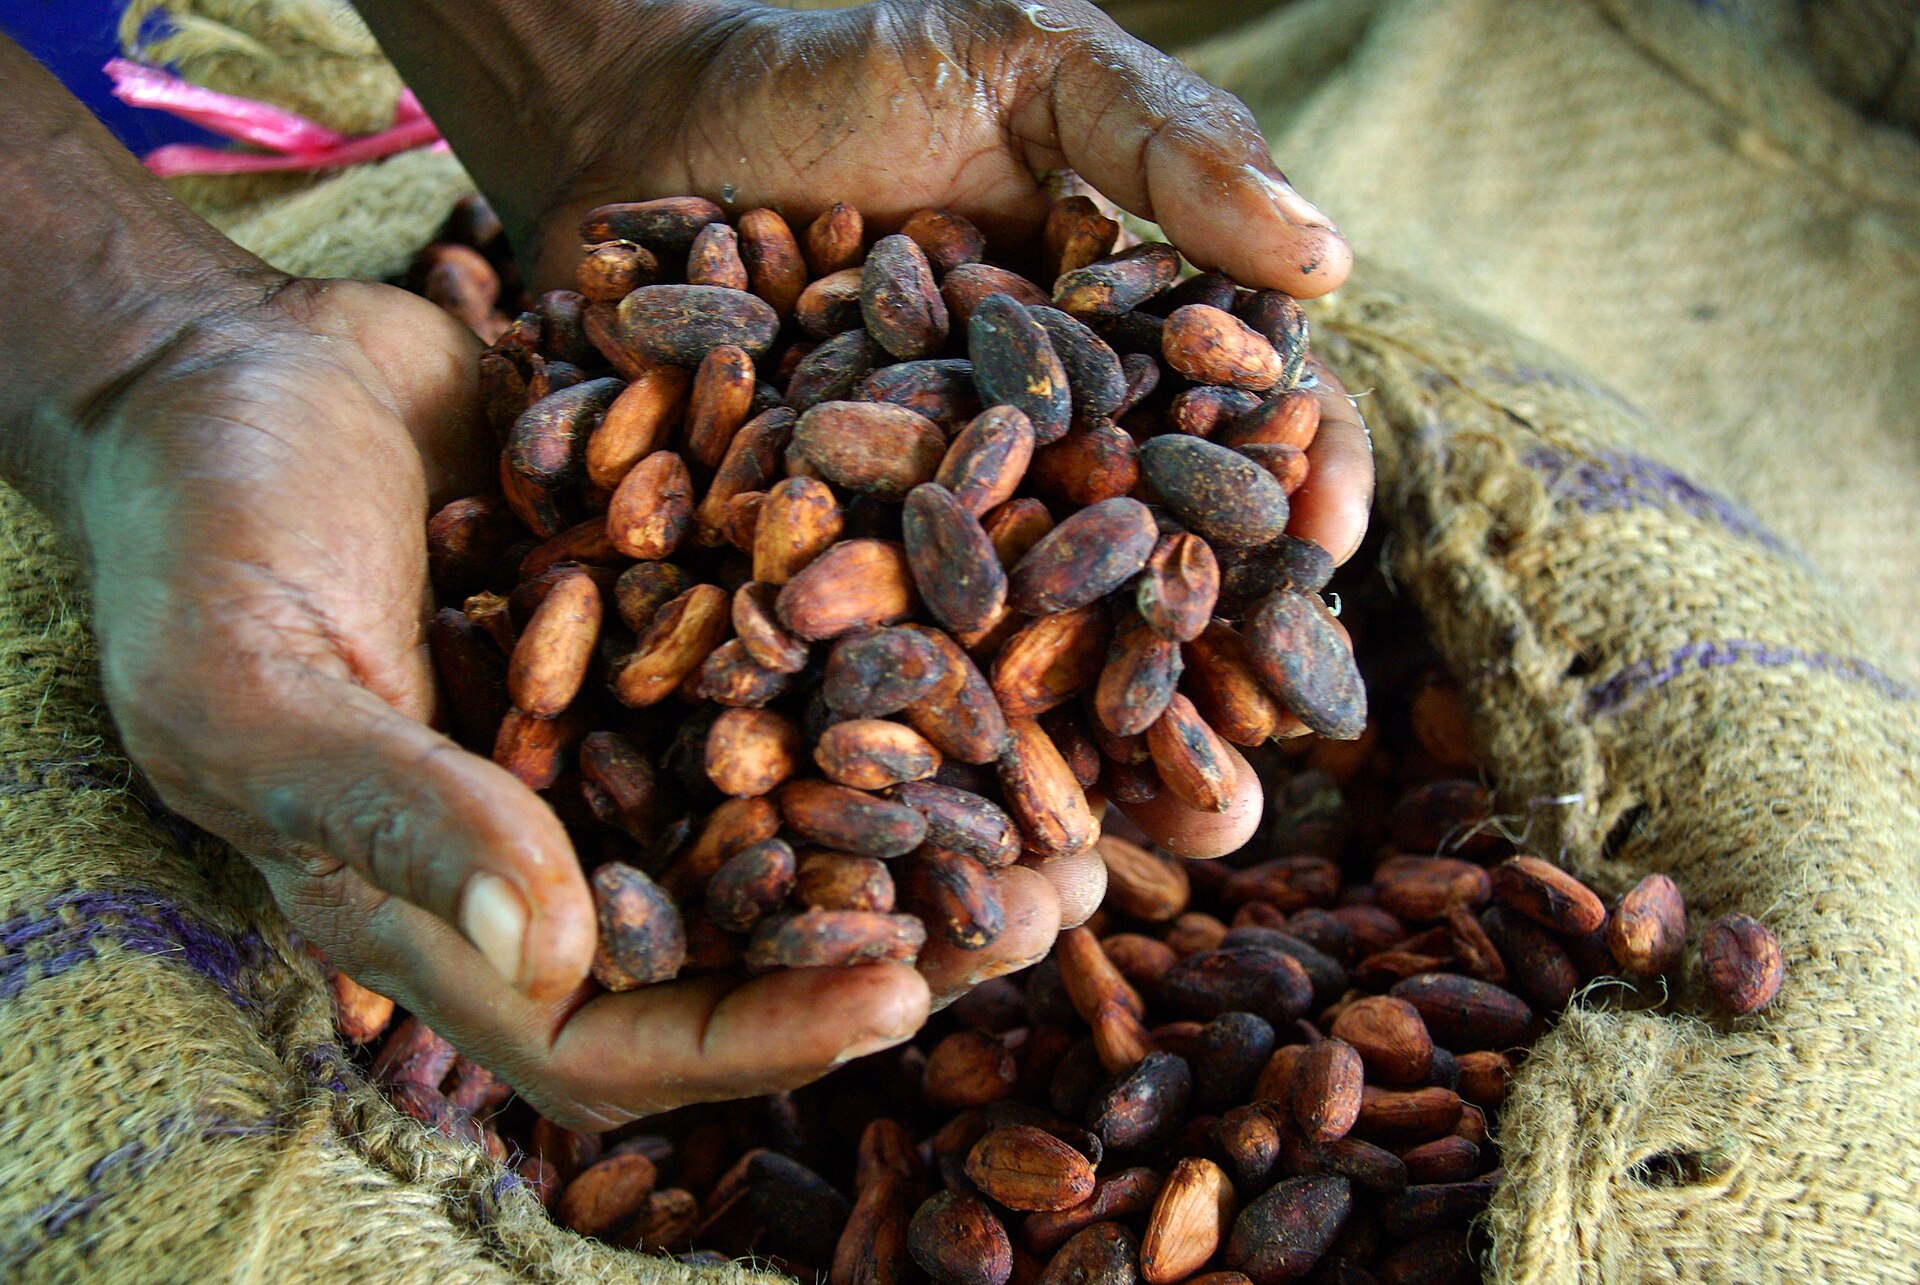
Because the bean is. Roughly three-quarters of the world's cocoa grows in a narrow West African belt, and that belt has been getting hotter than the trees can bear. Climate Central's attribution analysis found that human-caused warming has been adding at least three extra weeks a year above 32°C - the top of cacao's comfortable range - in Côte d'Ivoire and Ghana, and in 2024 added six weeks' worth across most of the growing region. That heat arrived on top of poor rains and crop disease, harvests disappointed, and the price did what the chart shows. Peer-reviewed projections point the same direction: published modelling expects a large share of today's cocoa-suitable land in West and Central Africa to become unsuitable by mid-century.
Cocoa's peak, measured against its own 20-year average
4.5×
Why is coffee so expensive right now?
Same shape, different continent. Arabica - the smoother bean in most supermarket bags - trades at $7.91 a kilo, 2.6 times its 2019-20 average, after setting an all-time record in February 2025. The seasons behind that run: drought and frost in Brazil in 2021, then a drought across the growing regions of Brazil and Vietnam - the two countries that supply over half the world's coffee - in 2024. World Weather Attribution's study of that drought found climate change, not El Niño, was its main driver, and Climate Central's coffee analysis counts the growing number of crop-harming hot days now added each year across the major producing countries.
Is everything getting dearer, then?
No - and this table is the page's most useful honesty. Over the past five years, 3 of the 11 commodities here rose more than 15%, led by cocoa at +141% - while 4 are cheaper than they were. Wheat, maize and soybeans, the calorie backbone of the food system, have gone roughly nowhere or down. The climate signal in food prices so far is not a general flood; it's specific crops, in specific places, with little room to move - which is exactly what makes the attribution science checkable.
| Commodity | Now | Five years ago | Change |
|---|---|---|---|
| Cocoa | $5.61 $/kg | $2.33 | +141% |
| Coffee (robusta) | $4.07 $/kg | $2.08 | +96% |
| Coffee (arabica) | $7.91 $/kg | $4.50 | +76% |
| Oranges | $0.78 $/kg | $0.69 | +13% |
| Rice | $467.00 $/mt | $414.00 | +13% |
| Tea | $2.98 $/kg | $2.65 | +12% |
| Wheat | $310.00 $/mt | $294.30 | +5% |
| Bananas | $1.17 $/kg | $1.23 | −5% |
| Sugar | $0.34 $/kg | $0.39 | −13% |
| Maize | $213.40 $/mt | $278.40 | −23% |
| Soybeans | $459.00 $/mt | $600.00 | −24% |
When does a world price reach your shelf?
Slowly, and smaller than you'd fear. The bean is one cost among many - roasting, packaging, transport, rent and wages absorb much of a spike, and supermarket contracts run months ahead. You can see the cushioning in coffee: the world arabica price stands at 2.6 times its 2019-20 level, while the American shelf price of ground coffee is $9.32 a pound, up 10.7% on a year ago. The direction travels; the multiple doesn't. Our grocery page tracks that shelf end every month, staple by staple.
Cocoa averaged $2.39/kg across 2003-2023; it trades at $5.61 now. A price can stop making headlines and still be resetting what chocolate costs to make.
Calculated from the chart aboveBananas, Sugar, Maize, Soybeans all cost less on the world market than in 2021. A page that told you everything is exploding would be easier to write, and wrong.
Calculated from the table aboveWhat these charts can't tell you
They can't forecast a harvest, and neither can we - the forward look belongs to the named studies linked above, and even those project decades, not seasons. World prices are also not your prices: the shelf end depends on your country's currency, taxes and retailers. And attribution science works event by event - each link here is a study of a specific place and period, not a blanket verdict on every price move. Where no study exists, the label is "weather, cause unattributed" - and we've kept to that.
Further reading
All of our numbers come from live, free sources - the world prices from the World Bank's Commodity Price Data (the "Pink Sheet", published monthly and openly licensed), and the shelf price from the Bureau of Labor Statistics via FRED. Every figure on this page is calculated from those series, and the page updates as they do.
If you want to dig deeper: Climate Central's cocoa and coffee analyses are free and readable, and the shelf end of this story - what your own groceries did this year - is our grocery prices page.